Auditing CSS is not a common task in a developer's everyday life, but sometimes you just have to do it. Maybe it's part of a performance review to identify critical CSS and reduce unused selectors. Perhaps is part of effort to improve accessibility where all the colors used in the codebase evaluated for contrast. It might even be to enforce consistency!
Whatever the case and whenever that moment arrives, I usually reach for some of the tools I'll cover in the article. But before that, let's see what it even means to "audit" CSS in the first place.
Auditing CSS is hard
Generally, code auditing involves analyzing code to find bugs or other irregularities, like possible performance issues. For most programming languages, the concept of auditing code is relatively straightforward: it works or it doesn't. But CSS is a specific language where errors are mostly ignored by browsers. Then there's the fact that you could achieve the same style in many different ways. This makes CSS a little tricky to audit, to say the least.
Finding those errors might be prevented by using an extension for your favorite code editor or setting up a linter or code checker. But that is not what I want to show here, and that is not enough. We could still use too many colors, typographic definitions, or z-indexes, all of which could lead to a messy, unmaintainable, unstable CSS codebase.
To truly audit CSS, we would need to dig deeper and find places that are not considered best practices. To find those places, we could use the following tools.
Browser DevTools
Let's take a look at the Chrome DevTools tools for CSS auditing. I'm using Brave here, which is Chromium-based. You might also want to check out this article by Umar Hansa, who compiled a whole bunch of great DevTool features that released in 2020.
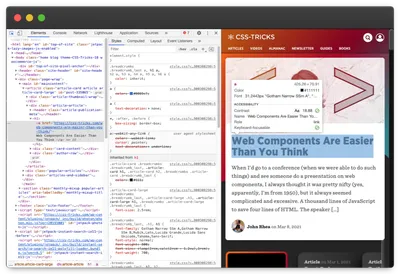
If you like inspecting CSS code manually, there is the Inspect tool. Using that, we could see the CSS code applied to a specific element. Using the "Inspect arrow" we could even see additional details about colors, fonts, size and accessibility.
Grid and Flex inspector
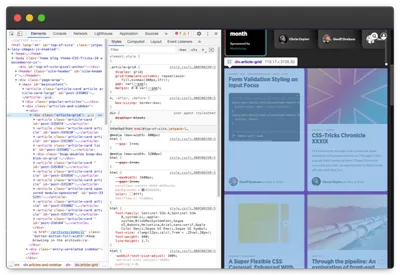
There's a lot of practical details in the DevTools interface, but my favorite is the Grid and Flex inspector. To enable them, go to the Settings (a little gear icon at the top right of the DevTools), click on Experiments, then enable CSS Grid and Flexbox debugging features. Although this tool is mainly used for debugging layout issues, I sometimes use it to quickly determine if CSS Grid or Flexbox is even used on the page at all.
CSS Overview
Inspecting CSS is pretty basic, and everything needs to be done manually. Let's look at some more advanced DevTools features.
CSS Overview is one of them. To enable CSS Overview tool, go to the Settings, click on Experiments, and enable CSS Overview option. To open the CSS Overview panel, you could use the CMD+Shift+P shortcut, type "css overview," then select "Show CSS Overview." This tool summarizes CSS properties like colors, fonts, contrast issues, unused declarations, and media queries. I usually use this tool to get the "feel" of how good or poor CSS code is. For example, if there are "50 shades of gray" or too many typographic definitions, that means that the style guide wasn't respected, or one might not even exist.
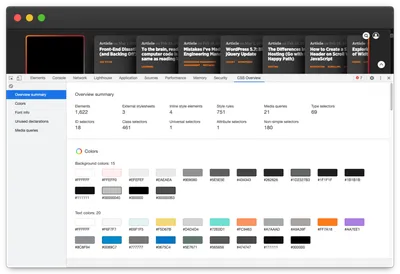
Note that this tool summarizes the style applied to a specific page, not the whole file.
Coverage panel
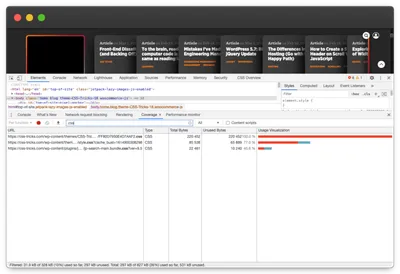
The Coverage tool shows the amount and the percentage of code used on the page. To view it, use the CMD+Shift+P shortcut, type "coverage," select Show Coverage, and click on the "refresh" icon.
You could filter only CSS files by typing ".css" in the URL filter input. I usually use this tool to understand the delivery technique of the site. For example, if I see that the coverage is pretty high, I could assume that the CSS file is generated for each page separately. It may not be critical data to know, but sometimes it helps to understand the caching strategy.
Rendering panel
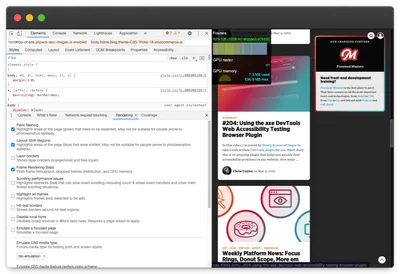
The Rendering panel is another useful tool. To open the Rendering panel, use CMD+Shift+P again, type "rendering" this time, and choose the "Show Rendering" option. This tool has many options, but my favorite ones are:
- Paint flashing — shows green rectangles when a repaint event happens. I use it to identify areas that take too much time for rendering.
- Layout Shift Regions — shows blue rectangles when the layout shift occurs. To make the most of these options, I usually set the "Slow 3G" preset under the "Network" tab. I sometimes record my screen and then slow down the video to find the layout shifts.
- Frame Rendering Stats — shows the real-time usage of GPU and frames. This tool is handy when identifying heavy animations and scrolling issues.
These tools are something that the regular audit doesn't imply, but I find it essential to understand if the CSS code is performant and doesn't drain a device's energy.
Other options may be more beneficial for debugging issues, like emulation and disabling of various features, forcing the prefers-color-scheme feature or print media type, and disabling local fonts.
Performance Monitor
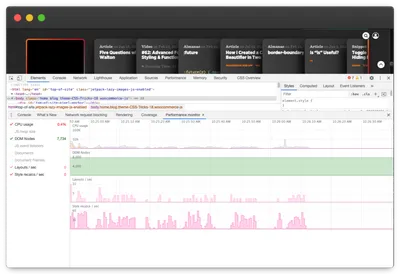
Another tool for auditing the performance CSS code is the Performance Monitor. To enable it, use CMD+Shift+P again, type "performance monitor," and select the Show Performance Monitor option. I usually use this tool to see how many recalculations and layouts are triggered when interacting with the page, or when the animation occurs.
Perfomance panel
The Performance panel shows a detailed view of all browser events during page load. To enable the Performance tool, do CMD+Shift+P, type "performance," select Show Performance, then click the "reload" icon. I usually enable the "Screenshots" and "Web Vitals" options. The most interesting metrics to me are First Paint, First Contentful Paint, Layout Shifts, and Largest Contentful Paint. There is also a pie chart showing the Painting and Rendering time.
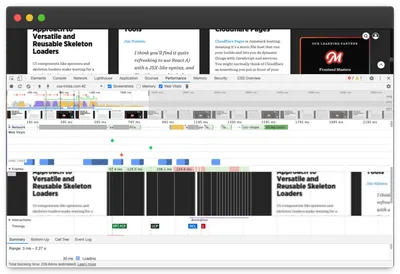
DevTools might not be considered a classical auditing tool, but it helps us understand which CSS features are used, the efficiency of the code, and how it performs — all of which are key things to audit.
Online tools
DevTools is just one tool that is packed with a lot of features. But there are other available tools we can use to audit CSS.
Specificity Visualizer
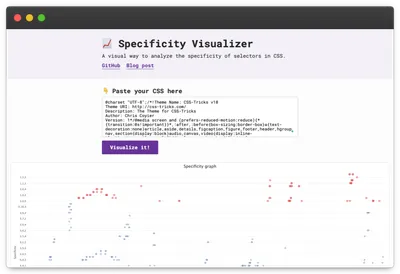
Specificity Visualizer shows the specificity of CSS selectors in the codebase. Simply visit the site and paste in the CSS.
The main chart displays the specificity in relation to the location in the stylesheet. The other two charts show the usage of specificities. I often use this site to find "bad" selectors. For example, if I see many specificities marked as red, I could easily conclude that the code could be better. It is helpful to save the screenshots for reference as you work to improve things.
CSS Specificity Graph Generator
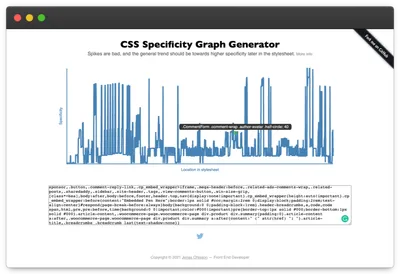
CSS Specificity Graph Generator is a similar tool for visualizing specificity. It shows a slightly different chart that might help you see how your CSS selectors are organized by specificity. As it says on the tool's page, "spikes are bad, and the general trend should be towards higher specificity later in the stylesheet." It would be interesting to discuss that further, but it's out of scope for this article. However, Harry Roberts did write about it extensively in his article "The Specificity Graph" which is worth checking out.
CSS Stats
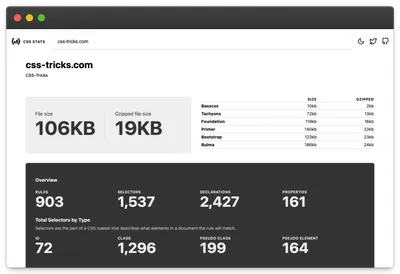
CSS Stats is another tool that provides analytics and visualizations for your stylesheets. In fact, Robin wrote about it a little while back and showed how he used it to audit the stylesheet at his job.
All you need to do is to enter the URL of the site and hit Enter. The information is segmented into meaningful sections, from declaration count to colors, typography, z-indexes, specificity, and more. Again, you might want to store the screenshots for later reference.
Project Wallace
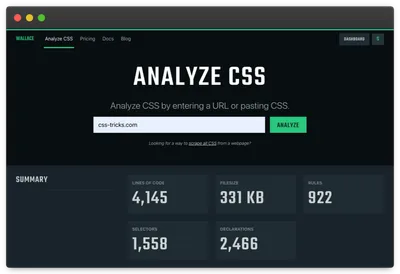
Project Wallace is made by Bart Veneman, who already introduced the project here on CSS-Tricks. The power of Project Wallace is that it can compare and visualize changes based on imports. That means you could see previous states of your CSS code base and see how your code changes between states. I find this feature quite useful, especially when you want to convince someone that the code is improved. The tool is free for a single project and offers paid plans for more projects.
CLI tools
In addition to DevTools and online tools, there are command line interface (CLI) tools that can help audit CSS.
Wallace
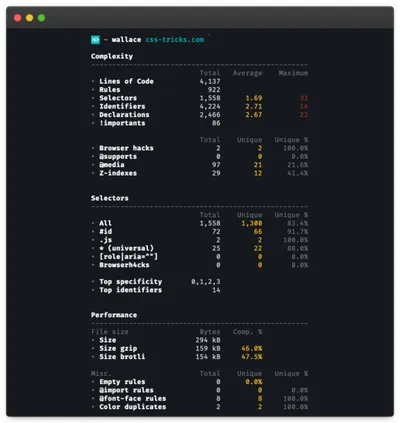
One of my favorite CLI tools is Wallace. Once installed, type wallace and then the site name. The output shows everything you need to know about the CSS code for the site. My favorite things to look at are the number of times !important is used, as well as how many IDs are in the code. Another neat piece of information is the top specificity number and how many selectors use it. These might be red flags for "bad" code.
What I like the most about this tool is that it extracts all of the CSS code from the site, not only external files, but also inline code as well. That is why the report from CSS Stats and Wallace mismatch.
csscss
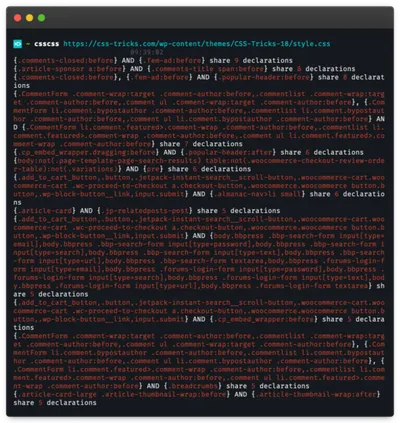
The csscss CLI tool shows which rules share the same declarations. This is useful for identifying duplicated code and opportunities to reduce the amount of code that's written. I would think twice before doing that as it might not be worthwhile, especially with today's caching mechanisms. It is worth mentioning that csscss requires Ruby.
Other useful tools
Other CSS tools might not be used for auditing but are still useful. Let's list those, too:
- Color Sorter — Sort CSS colors by hue, then by saturation.
- CSS Analyzer — Generate an analysis for a string of CSS.
- constyble — This is a CSS complexity linter, based on CSS Analyzer.
- Extract CSS Now — Get all the CSS from a single webpage.
- Get CSS — Scrape all the CSS from a page.
- uCSS — Crawl websites to identify unused CSS.
Conclusion
CSS is everywhere around us, and we need to consider it a first-class citizen of every project. It does not matter what other people think about your CSS, but what you think about it really does matter. If your CSS is organized and well-written, you will spend less time debugging it and more time developing new features. In an ideal world, we would educate everyone to write good CSS, but that takes time.
Let today be the day when you start caring for your CSS code.
I know that auditing CSS isn't going to be fun for everyone. But if you run your code against any of these tools and try to improve even one part of your CSS codebase, then this post has done its job.
I am thinking about CSS code more and more lately, and I am trying to make more developers write CSS code more respectfully. I even started a new project at css-auditors.com (yay for hyphenated domain names!) that's dedicated to auditing CSS.
If you know of any other tools, let me know in the comments.